I Went to Google Cloud Next and Came Back Obsessed With AI Observability 🔗
FYI the full working example I talk about in this blog is in the dash0-examples repository. This post walks through why it exists and what you get when you run it.
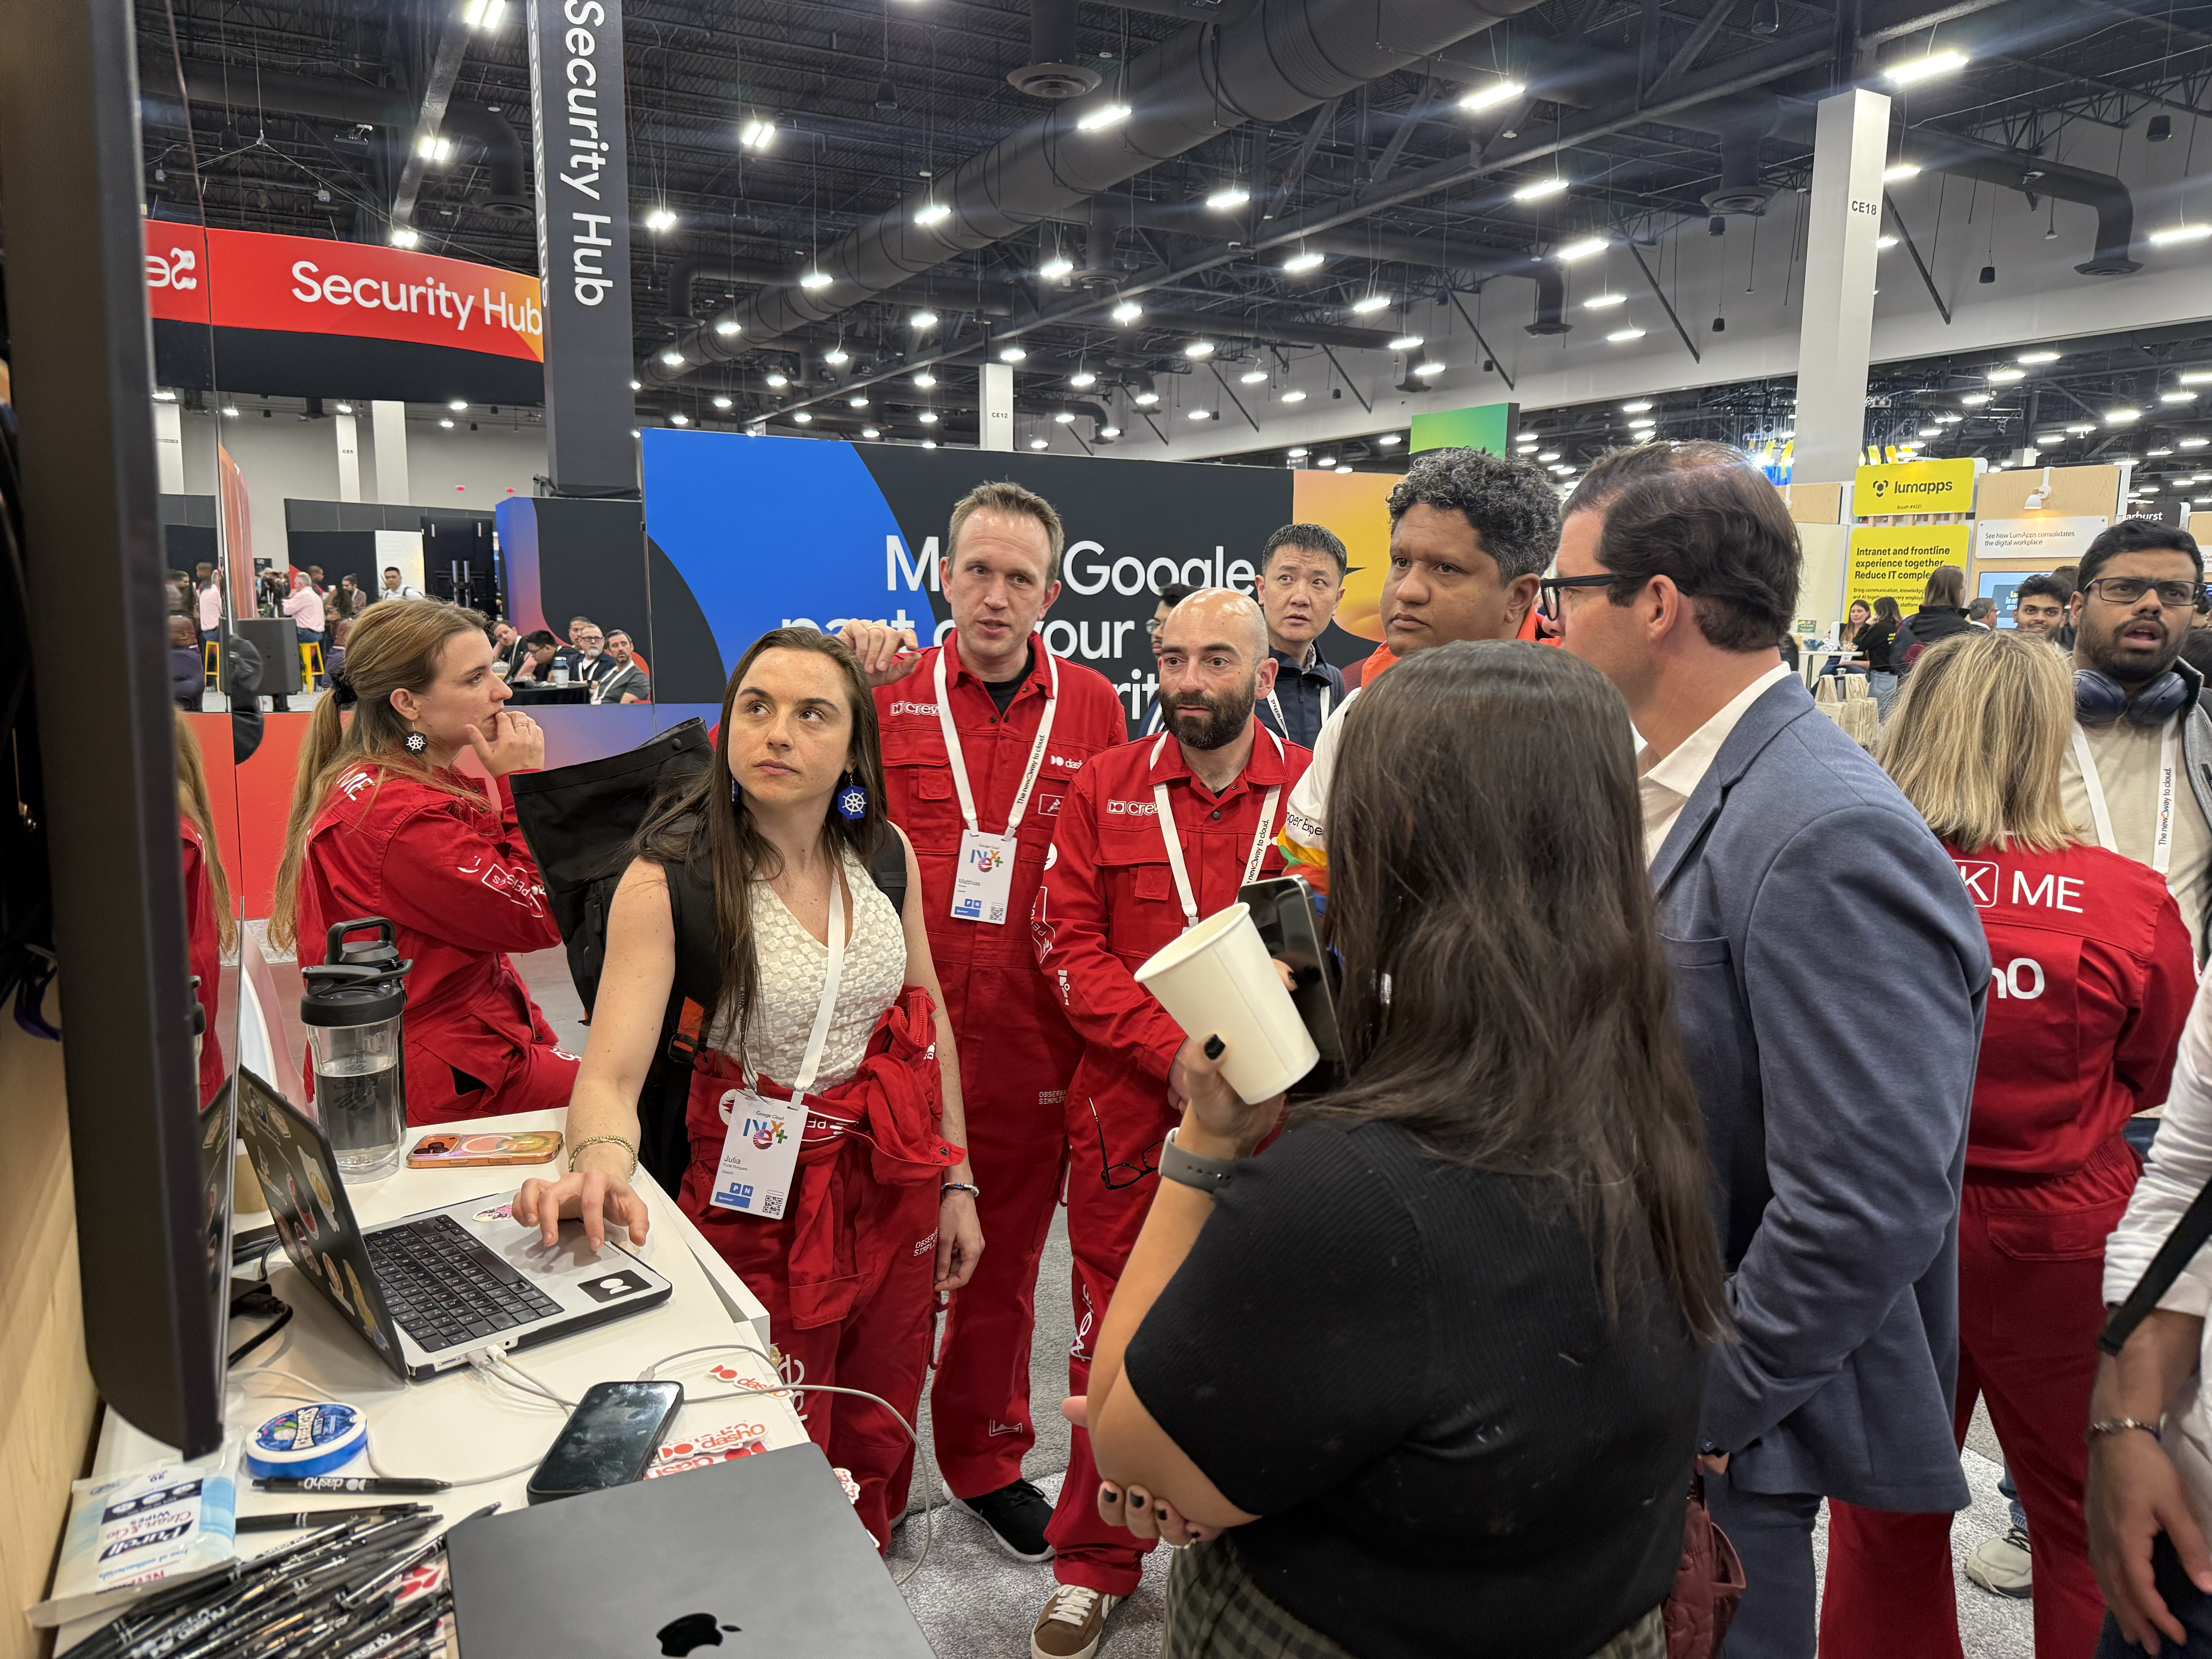
I just got back from Google Cloud Next a week ago and honestly I’m still processing it. I had an amazing time. It was my first Google conference and it surpassed my expectations. Besides spending time at the booth demoing in English and Portuguese (yes!) I walked around the expo hall and the one topic that came up everywhere, in every session, every booth, every hallway conversation, was agents. AI agents.
AI.
AI systems making decisions, calling tools, spinning up other agents, writing code, deploying things. I went in expecting a lot of cloud infrastructure content and came out with my head full of agentic pipelines. And somewhere around day two, a thought crept in that I couldn’t shake:
If this thing starts behaving weirdly at 3am (slow responses, bad outputs, runaway costs), where do you even start looking?
That question sent me down a rabbit hole because you need to be able to see inside it. Not just “is it up or down.” Actually see what’s happening inside the AI.
So I built a small demo to figure out what that looks like in practice. I started with the inference layer, specifically vLLM, which is what a lot of teams use to self-host AI models (and it’s Open Source!). Let me share what I learned.
First: what is vLLM and why does it matter? 🔗
If you’ve heard of ChatGPT but not vLLM, here’s the quick version: ChatGPT is a product. Under the hood there’s a model (the actual AI brain) and a server that handles all the requests like taking in text, running it through the model, and returning a response.
vLLM is one of those servers. It’s what many teams use when they want to host their own AI model instead of paying for someone else’s API. It’s fast, it’s open source, and it’s become kind of the standard for self-hosted AI serving.
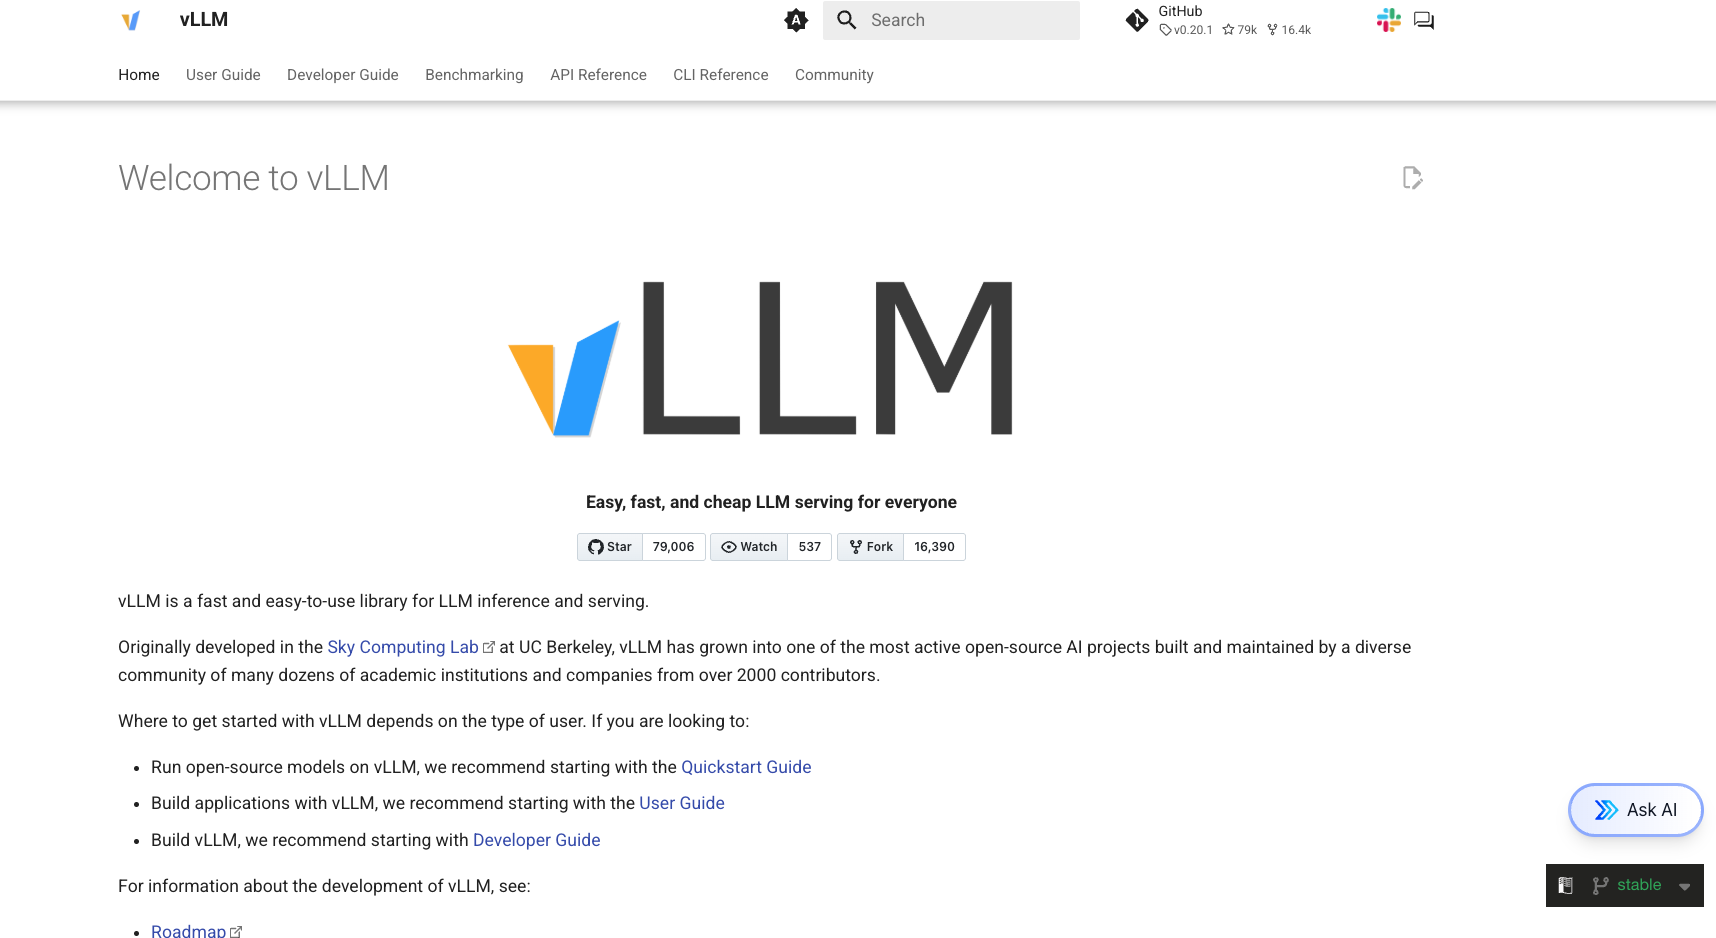
The interesting part for us is that vLLM has observability built in. You can configure it to automatically report what it’s doing, and that data flows into your monitoring tools with almost no extra code. I say “almost” because you do need to pass a flag and set up a collector, which I’ll get to. But no custom instrumentation code in your application.
What does “observability” even mean for an AI? 🔗
I understand things better by using analogies so imagine your AI model is a restaurant kitchen. Customers (users) send in orders (requests). The kitchen (the AI server) prepares the food (generates responses) and sends it back.
Now something goes wrong. Orders are taking forever. What do you do?
Without observability, you’re standing outside the kitchen with no windows. You know orders are slow. That’s it.
With observability, you can see:
- How many orders are waiting to be started
- Which orders are currently being cooked
- Which step is taking the longest (is it the prep work or the actual cooking?)
- How full the kitchen’s workspace is (if it overflows, orders get preempted and have to start over)
Standard web servers have versions of all these problems. But AI servers have their own flavor of each one, and the signals you need to watch are completely different. That’s why vLLM ships its own observability layer.
The two types of data you get 🔗
Traces: GPS tracking for your request 🔗
A trace is a recording of everything that happened to a single request. Every step, in order, with timestamps.
When your app sends a question to the AI:
- Your app receives the request
- Your app fetches some context (if you’re using RAG)
- Your app calls the AI model
- The AI server schedules the request
- The AI generates the response, token by token
- The answer comes back
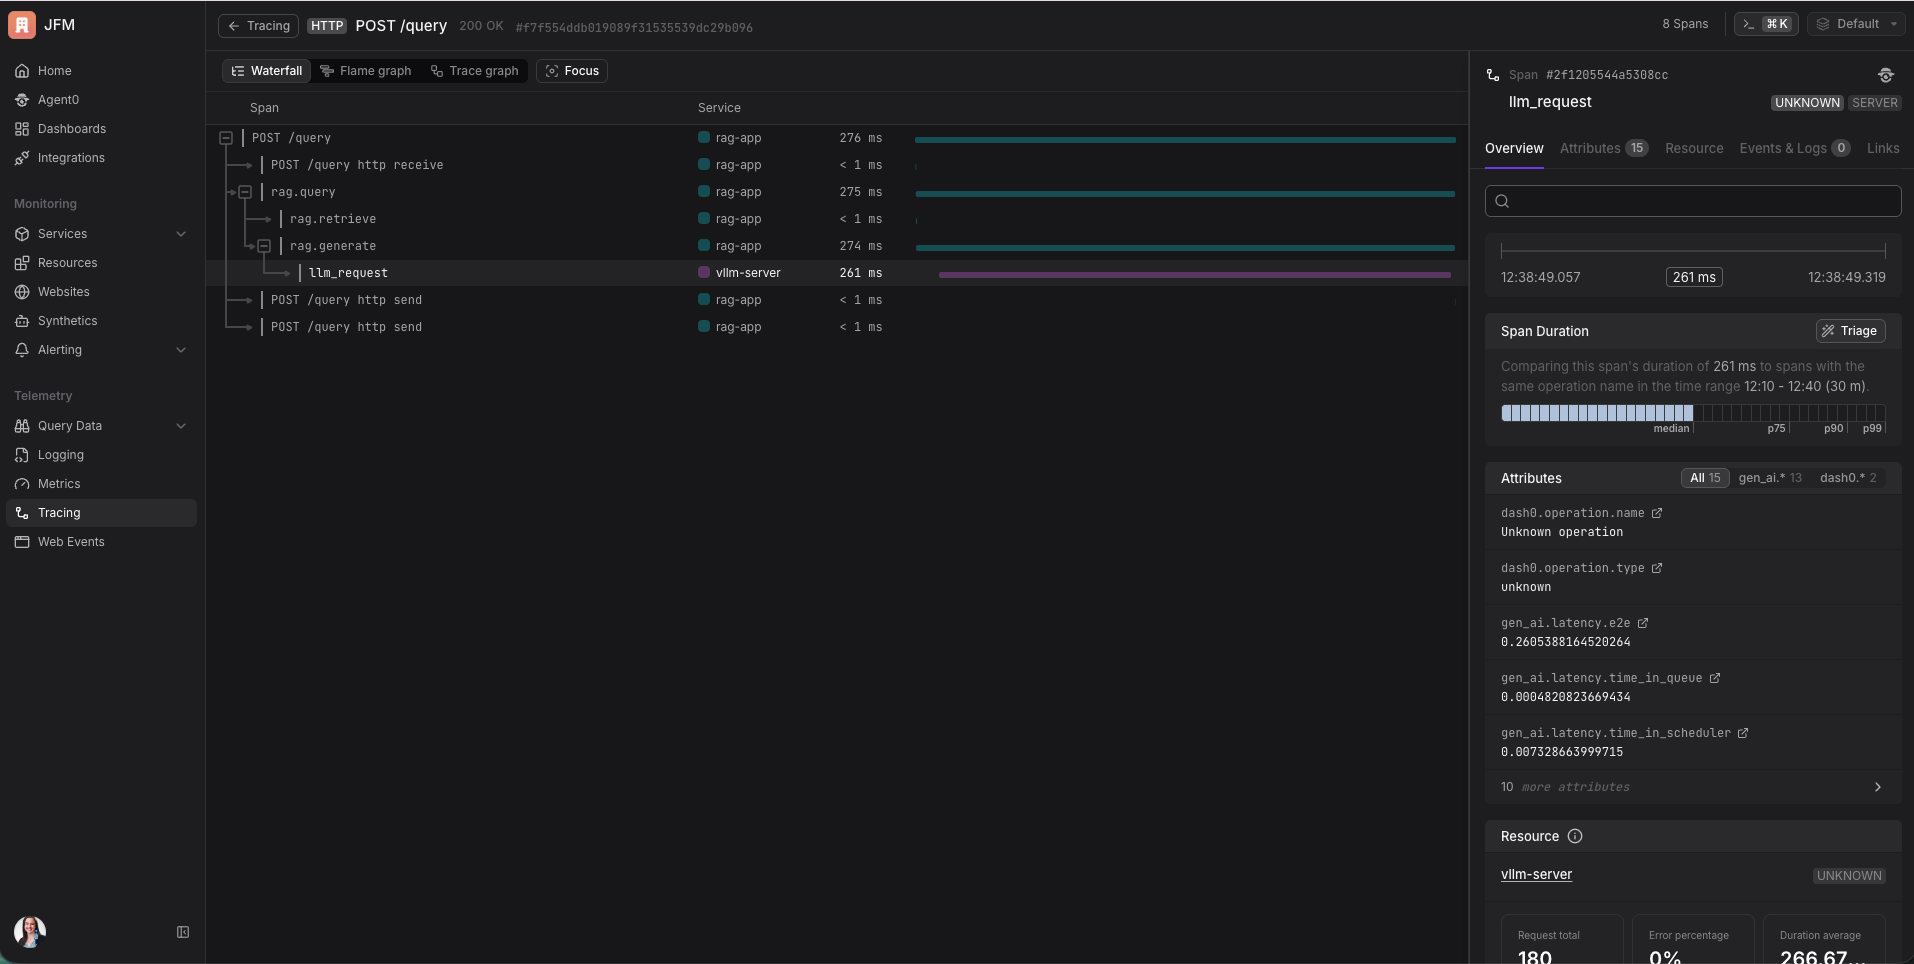
A trace captures all of that and shows you exactly where time was spent. Was the AI slow because the server was overwhelmed with other requests? Was it slow because the prompt was really long? The trace tells you.
If you set it up correctly, you get one continuous trace across multiple services. My RAG app and the vLLM server are two separate processes, but in Dash0 I can see them as one connected waterfall. “My app spent 85ms fetching documents and 360ms waiting for the AI.” In a single view. Without any extra plumbing beyond injecting one header. It beautiful to see that.
Metrics: the dashboard on your kitchen wall 🔗
Metrics are numbers that update over time. Less detail than traces, but easier to watch continuously and set alerts on.
The ones that actually matter:
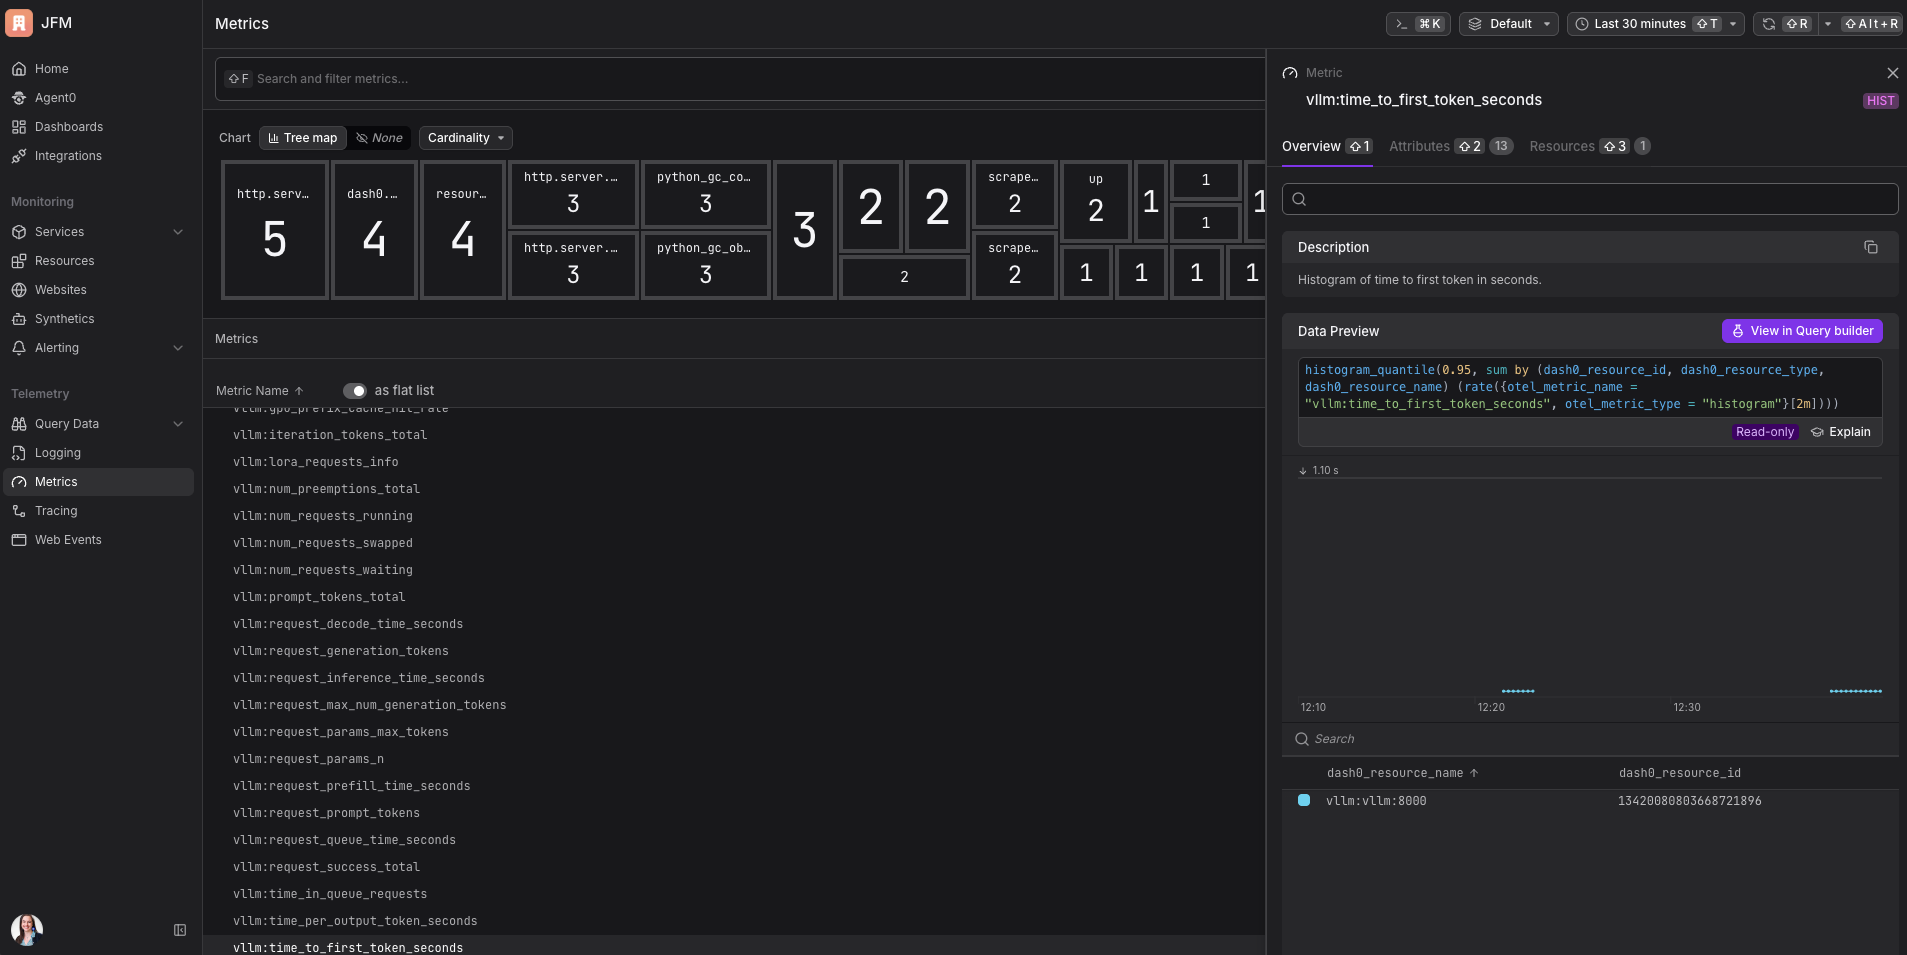
Time to first token. How long until the user sees the first word of the response. For anything with a streaming UI where text appears as it’s generated, this is what determines whether the product feels fast. I had no idea this was tracked separately from total latency before digging into vLLM. It makes so much sense in hindsight.
GPU cache usage. This one needs its own analogy. The GPU has a special kind of working memory called the KV cache. Think of it like a chef’s notepad: when the chef is partway through a complex recipe, they write notes so they don’t lose their place. The AI does the same thing mid-generation. When the notepad fills up, the chef has to erase someone else’s notes to make room, meaning that person’s order has to start over. In vLLM this is called a preemption, and it causes sudden latency spikes that show up as slow requests rather than errors. The GPU cache usage metric tells you how full that notepad is before things start getting erased. I would never have thought to look for this metric before this project. It’s now the first thing I check.
Requests waiting. How many requests are queued but not yet being processed. This rises before latency blows up. It’s a leading indicator, which is exactly the kind of signal that’s actually useful for capacity planning.
Tokens per second. The throughput of your setup. Useful for knowing whether you’re getting value out of your hardware.
How the data flows 🔗
Here’s the architecture in plain terms:
Your app
  │
  │ sends a question
  ▼
vLLM (the AI server)
  │
  ├── sends trace data automatically → OTel Collector
  └── exposes metrics at /metrics → OTel Collector scrapes it
                                          │
                                          │ forwards everything
                                          ▼
                                        Dash0
                                   (where you see it all)
The OTel Collector is a middleman that receives data from multiple sources and forwards it to your observability backend. Think of it as the building’s mail room: everything gets routed through it before going to its final destination. It also handles things like batching, retries, and enriching telemetry with extra context, which is why you want it in the pipeline rather than sending directly.
OpenTelemetry (OTel) is the standard format all of this uses. It’s vendor-neutral, which means the same setup works whether you’re sending to Dash0, Grafana, or anything else that speaks OTel. I use Dash0 because it’s what I use at work, because I work there lol. Seeing vLLM metrics and traces show up in the same view without writing any glue code was the moment it really clicked for me. If you’re curious why OTel-native matters, that post explains it well.
Setting it up 🔗
The full setup is in the dash0-examples repo.
What you need:
- Docker and Docker Compose
- A machine with an NVIDIA GPU
- A Dash0 account (consumption-based, free for 14 days)
The GPU thing. This tripped me up. I assumed I could just run the demo locally on my Mac, maybe slowly. Nope. The vLLM Docker image is compiled specifically for NVIDIA CUDA. It’s not a “runs slower without a GPU” situation, it simply won’t run. I spent an embarrassing amount of time trying to make it work before accepting reality and spinning up a Google Cloud instance.
For testing I used an n1-standard-4 with a T4 GPU attached on Google Cloud (about $0.50/hour). More than enough for the small model in this demo. One thing to check before you try this: Google Cloud limits how many GPUs you can use by default, sometimes to zero. Go to IAM & Admin → Quotas in the Google Cloud Console, search for NVIDIA_T4_GPUS, select your region, and request an increase. It usually gets approved within a few hours. I didn’t know this existed until I hit the limit and got a cryptic error instead of a helpful message.
The nice thing about Google Cloud: you can SSH into your instance with gcloud compute ssh instead of managing .pem key files. No chmod 400, no “where did I put that key” moments:
gcloud compute ssh your-instance-name --zone=us-central1-a
And once you’re done running it remember to stop the instance!! Otherwise you’ll get a huge bill at the end of the month.
The model loading wait. The first time you run docker compose up, vLLM downloads the model weights and loads them into GPU memory. This takes 2 to 5 minutes. The stack looks frozen. It’s not frozen. Wait for this line before sending any requests:
INFO: Application startup complete.
I sent requests before seeing this line on my first attempt. I got very confused about why nothing was working. Now you know.
Steps:
-
Clone the repo:
git clone https://github.com/dash0hq/dash0-examples.git cd dash0-examples/vllm -
Add your Dash0 credentials to the
.envfile at the repo root. You can get the credentials in the settings page in your account.DASH0_AUTH_TOKEN=your_token_here DASH0_DATASET=default DASH0_ENDPOINT_OTLP_GRPC_HOSTNAME=ingress.us-west-2.aws.dash0.com DASH0_ENDPOINT_OTLP_GRPC_PORT=4317 -
Start everything (requires an NVIDIA GPU, or see the vLLM setup section in the technical deep-dive for how to run on CPU):
docker compose up --build -
Wait for the model to load. Look for
Application startup complete.in the logs. -
Send a test request:
python scripts/send-request.py
Then go to Dash0. Data should be flowing.
What you actually see 🔗
This is the part that made the whole thing worth it.
In traces, each request shows up as a connected tree. You can see the full flow from your app receiving the request all the way through to the AI finishing generation, with timing on every step. The AI’s span has attributes showing how many tokens were in the prompt, how many were generated, and what the latency breakdown looks like inside vLLM (time waiting in queue, time in prefill, time in decode).
In metrics, you get a live view of the AI server’s health. Is the GPU cache filling up? Is a queue forming? The metric I’d set an alert on first: time to first token at the 95th percentile. If that’s rising, users are feeling it before anything else breaks.
Why this matters beyond the demo 🔗
This is the thing I kept thinking about on the flight home from Google Cloud Next.
The agents everyone was demoing aren’t single models. They’re pipelines with an orchestrator calling tools, fetching data, spinning up sub-agents, calling a model, processing the result, calling the model again. Each step can fail. Each step has latency. Without instrumentation you’re debugging that system completely blind.
But if each component propagates trace context through its calls, and if the AI layer emits its own spans, you end up with one continuous trace per user interaction that covers the entire execution. You can see where time went, which tool calls were slow, and whether the model or the surrounding infrastructure was the bottleneck.
That’s what I wanted to be able to do. This demo is step one. A lot of people in the cloud-native community are working through this exact problem right now. I don’t have all the answers yet, but I think building and sharing as we go is how we figure it out together.
If you want to see what agentic observability looks like once the infrastructure is in place, Dash0 has a practical guide worth reading alongside this post.
Try it yourself 🔗
The full working example is at dash0-examples/vllm. Clone it, point it at your model, and see your inference layer become observable in minutes. Start your free Dash0 trial if you don’t have an account yet.
If you try it and hit anything confusing, find me on LinkedIn. And if you’re already thinking about how to extend this to full agent pipelines, so am I. That’s what I’m working on next. 💙